
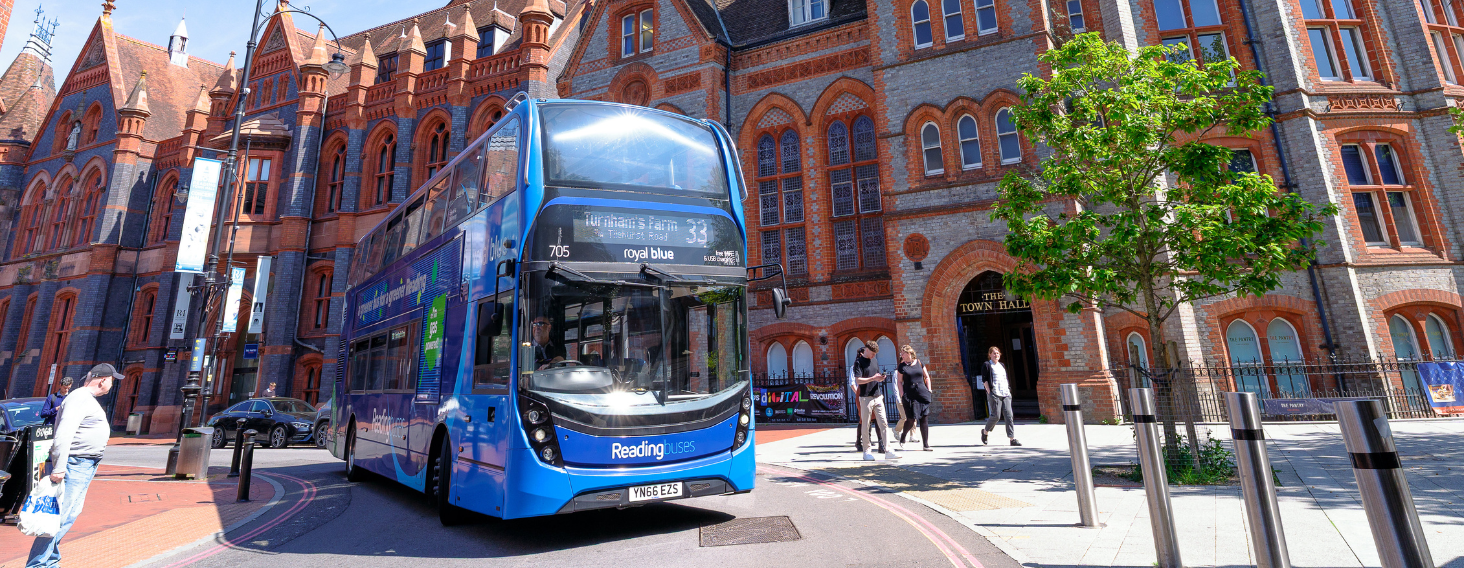
Reading Buses were celebrating a top 3 result in the Your Bus Journey survey for customer satisfaction with their rating rising to 92%.
Reading Buses’ operational area was third overall, with the company themselves coming in at 5th – just two percentage points behind the table leader.
The Your Bus Journey survey is an annual questionnaire that is compiled by the independent transport watchdog Transport Focus with many bus companies up and down the country taking part. It benchmarks the same factors of satisfaction in each survey so operators and local authorities can see where they do well and where they need to improve for their own area, but also in comparison to others.
Reading Buses said that many of the metrics had improved not only year-on-year but have continually improved over the last few years.
The company’s overall satisfaction improved to 92% from 89% last year and 86% the year before. This was also a full seven percentage points higher than the national average.
Said Robert Williams, Reading Buses Chief Executive Officer; “This is a huge endorsement for Reading Buses, its employees and our ethos of how we operate in the town. To see so many metrics improve is extremely heartening and helps confirm that what we are doing is the right thing. We put our customers and employees at the heart of everything we do to make buses a better choice for everyone.”
One of the most pleasing aspects for the company was that the satisfaction with the bus driver rose again, climbing to 92%.
Said Robert; “We know our drivers are superstars, and once again the results show that our customers think that too!”
Punctuality rose to 89% from 83% last year and the length of time to wait for a bus improved to 86% from 83% the previous year.
The company also rated highly for on-board amenities, especially when compared to the national average. Audio announcements, which help visually impaired people as well as customers who aren’t sure where to get off, were rated at 72% – a huge jump of 12 percentage points year-on-year and 23 points higher than the national average. Likewise the on-board screens, which also show the next stop/this stop display as well as on-board adverts, were at 75%, eight percentage points higher than last year and 24 points higher than the average.
“Getting direct customer feedback is always important,” continued Robert, “but it is especially pleasing when they notice all the hard work that has gone into making buses in Reading, and the surrounding area, more welcoming, useful and usable. We hope that results like this encourage more people to step out of their cars and try the bus – they will definitely be pleasantly surprised.”